
영화 리뷰 데이터 분석의 마지막 단계로 리뷰에서 단어들만을 추출한 뒤, 빈도 분석과 wordcloud를 활용한 시각화를 진행해봅니다.
4.1 긍정, 부정 리뷰 키워드 분석
처음 전처리 과정을 거친 데이터 셋을 불러옵니다. (생략해도 무방)
df_reviews
이전 레이블링한 긍정 리뷰와 부정 리뷰를 활용하기 위해 변수 선언으로 불러옵니다.
pos_reviews = df_reviews[df_reviews['label'] == 1]
neg_reviews = df_reviews[df_reviews['label'] == 0]
그다음 한글 형태소 분석을 위해 해당 리뷰들에서 한글 이외의 문자를 제거합니다.
import re
#-- 긍정 리뷰
pos_reviews['comment'] = pos_reviews['comment'].apply(lambda x: re.sub(r'[^ㄱ-ㅣ가-힝+]', ' ', x))
#-- 부정 리뷰
neg_reviews['comment'] = neg_reviews['comment'].apply(lambda x: re.sub(r'[^ㄱ-ㅣ가-힝+]', ' ', x))
이제 긍정 리뷰에 대한 형태소 분석을 실시해보도록 합니다. 먼저 필요한 라이브러리를 임포트하고 리뷰들에서 명사(1글자 이상)만을 추출합니다.
import jpype
from konlpy.tag import Okt
okt = Okt()

pos_comment_nouns = []
for cmt in pos_reviews['comment']:
    pos_comment_nouns.extend(okt.nouns(cmt)) #-- 명사만 추출
#-- 추출된 명사 중에서 길이가 1보다 큰 단어만 추출
pos_comment_nouns2 = []
word = [w for w in pos_comment_nouns if len(w) > 1]
pos_comment_nouns2.extend(word)
긍정 리뷰에 대한 단어 추출이 바르게 처리되었는지 해당 코드로 확인합니다.
pos_comment_nouns2
그리고 해당 단어들에 대한 빈도 수를 계산합니다.
from collections import Counter
pos_word_count = Counter(pos_comment_nouns2)

pos_word_count
마지막으로 상위 20개의 빈도수를 가진 단어들로 나열해봅니다.
max = 20
pos_top_20 = {}
for word, counts in pos_word_count.most_common(max):
    pos_top_20[word] = counts
    print(f'{word} : {counts}')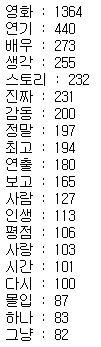
4.2 형태소 시각화
위에서 추출한 상위 20개의 빈도수가 높은 단어들로 그래프를 생성해봅니다.
plt.figure(figsize=(10, 5))
plt.title('긍정 리뷰의 단어 상위 (%d개)' % max, fontsize=17)
plt.ylabel('단어의 빈도수')
plt.xticks(rotation=70)
for key, value in pos_top_20.items():
    if key == '영화': continue
    plt.bar(key, value, color='lightgrey')
plt.show()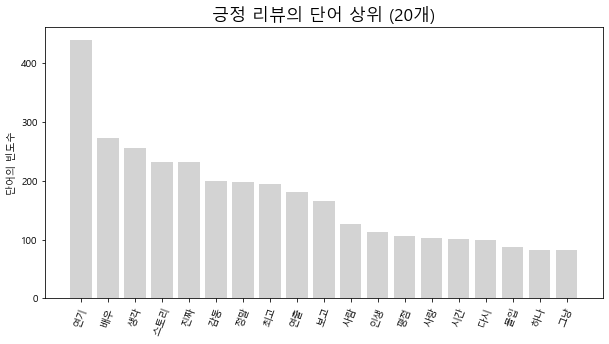
긍정 리뷰와 똑같은 방식으로 부정 리뷰에 대한 단어 빈도수 분석도 실시합니다.
#-- 부정 리뷰 명사 추출
neg_comment_nouns = []
for cmt in neg_reviews['comment']:
    neg_comment_nouns.extend(okt.nouns(cmt))

neg_comment_nouns2 = []
word = [w for w in neg_comment_nouns if len(w) > 1]
neg_comment_nouns2.extend(word)

#-- 단어 빈도 계산
neg_word_count = Counter(neg_comment_nouns2)

#-- 빈도수가 많은 상위 20개 단어 추출
neg_top_20 = {}
for word, counts in neg_word_count.most_common(max):
    neg_top_20[word] = counts
    print(f'{word} : {counts}')

#-- 그래프 작성
plt.figure(figsize=(10, 5))
plt.title('부정 리뷰의 단어 상위 (%d개)' % max, fontsize=17)
plt.ylabel('단어의 빈도수')
plt.xticks(rotation=70)
for key, value in neg_top_20.items():
    if key == '영화': continue
    plt.bar(key, value, color='lightgrey')
plt.show()
4.3 wordcloud 생성
from wordcloud import WordCloud먼저 긍정 리뷰에 대한 wordcloud를 생성합니다.
wc = WordCloud(font_path, background_color='ivory', width=800, height=600)
cloud = wc.generate_from_frequencies(pos_word_count)
plt.figure(figsize=(8,8))
plt.imshow(cloud)
plt.axis('off')
plt.show()
다음으로 부정 리뷰에 대한 wordcloud를 생성합니다.
wc = WordCloud(font_path, background_color='ivory', width=800, height=600)
cloud = wc.generate_from_frequencies(neg_word_count)
plt.figure(figsize=(8,8))
plt.imshow(cloud)
plt.axis('off')
plt.show()
지금까지 웹페이지에서 데이터를 크롤링한 뒤 이를 레이블링 및 전처리 후 시각화하는 과정을 작게나마 구현해 보았습니다. 사실 평점을 기준으로 긍정적인 표현과 부정적인 표현을 구분짓는다는 것은 조금 오류가 있을 수 있으나, 조금 단순한 논리로 다가가기 위해 진행했습니다.
'Project > Movie Review Data Visualization' 카테고리의 다른 글
| [Project] 영화 리뷰 데이터 감정분석&시각화 - 3. 리뷰 통계 분석 (0) | 2022.02.09 |
|---|---|
| [Project] 영화 리뷰 데이터 감정분석&시각화 - 2. 웹페이지 크롤링 (0) | 2022.02.09 |
| [Project] 영화 리뷰 데이터 감정분석&시각화 - 1. 라이브러리(KoNLPy, wordcloud) 설치 (2) | 2022.02.09 |


댓글